Elasticsearch
Background
Elasticsearch in VMware Workspace ONE Access is used for storing records on:
- Audit Events and Dashboards (all events)
- Sync Logs (LDAP)
- Search data, Peoplesearch (users, groups, apps)
- Entitlements (apps)
These records are collected on the local SAAS node and are being sent to RabbitMQ instance on the local node once per second. They are then picked up and sent to Analytics Service on local node, which then sends the records for storing in Elasticsearch. RabbitMQ acts as a buffer, so that if Elasticsearch is down, the records are not lost. It also decouples the generation rate from the storing rate, so if records are coming in faster than they can be stored, they can be queued up and left in RabbitMQ.
RabbitMQ previously WAS clustered, so records generated on one node could be picked up and processed by any other node in the cluster. This meant that if the local Elasticsearch instance is having issues, another node could grab the message and process them. Now RabbitMQ is NOT clustered (it had complex node stop/start order requirements to maintain a stable cluster, and maintaining a RabbitMQ cluster was more hassle than it was worth), so it is possible for the records generated on one node to start piling up in RabbitMQ. This is less robust, but makes it easier to spot when a specific node is having a problem.
Services connected to Elasticsearch:
- elasticsearch
- horizon-workspace
- hzn-dots
- hzn-network
- hzn-sysconfig
- rabbitmq-server
- thinapprepo (optional, only if ThinApp is used)
- vpostgres (optional, only for internal DB)
Elasticsearch Indices and Shards
Elasticsearch is a distributed, replicated data store, which means each node does not have full copy of the data. In a 3-node cluster, each node will have 2/3 of the data, so that all 3 nodes combined provides 2 full copies, and you can lose one node without losing any data. This distribution and replication is achieved by splitting each index into 5 shards and each shard has a primary copy and a replica (backup) copy. All ten shards for an index are then distributed across all three nodes so that no single node has both the primary and replica copy of any one shard, or all the shards for one index.
Audit data and sync logs are stored in a separate index for each day. The index is versioned based on the document structure so that you can seamlessly migrate from an old format to a new format. The audit indexes have the format "v<version>_<year>-<month>-<day>'. For example, version 4 of the document structure will be "v4_2022-03-04".
Search data (users, groups, applications) used by the admin UI for search and autocomplete, and the PeopleSearch feature, is stored in a separate index called "v<version>_searchentities", and currently uses version 2 of that document structure.
⭐️ The indices can be seen in the /db/elasticsearch/horizon/nodes/0/indices directory or listed with useful stats via: curl localhost:9200/_cat/indices?v
Elasticsearch Node Discovery
A cluster has a master node which has the additional job of coordinating the distribution of data and farms out the search and document retrieval requests to the other nodes based on which node has which shard. Any node can be the master node, the nodes choose the master themselves based on the makeup of the cluster. If the master node disappears, one of the remaining nodes is chosen as the new master.
Elasticsearch uses a list to determine how many nodes it should be able to see before a master can be elected and the cluster formed (and the other nodes its should be reaching out to). This is done to prevent a split-brain situation, where due to network issues not all the nodes can see each other, so form independent clusters, which require resetting the errant node and losing its data. So when WS1 Access tells Elasticsearch there should be 3 nodes, it knows it must see at least 2 nodes to form a cluster.
❗️If Elasticsearch is up before WS1 Access (horizon-workspace service), there will be timeout failures in the logs, which can result in the cluster getting stuck. If the other nodes in the cluster are not up, there will be error messages about trying to add them to the cluster and then removing them again because they did not respond.
Data Retention
❗️Due to rules and regulations in some countries and companies around data retention of audit data, by default historical data is not deleted.
Elasticsearch maintains a very complex series of lookup tables in memory that allows it to determine which documents match a particular query in just a couple of milliseconds, whether there is one document to query or a billion.
By default, to reduce memory footprint, the number of days (indices) allowed for Elasticsearch to keep in memory (or open) is limited to 90 days.
Older indices are closed to remove them from memory and are no longer searchable. Once a day, just after midnight (00:30am), the retention policy is executed, and any open index that is older than the 90 days is closed.
Also the open indices that are no longer being written to (any open index older than the current day) are optimized:
As documents come in, Elasticsearch writes them to lots of small files on disk. This lets it store documents quickly, but slows down retrieval and consumes a huge amount of open file descriptors. When an index is no longer being written to (for example, because it is for yesterday and no dated records for yesterday should be coming in anymore to write to it), Elasticsearch takes all those little files and combines them into one big file. This reduces the number of file descriptors needed and speeds up document retrieval for older documents.
When the retention policy runs, there will be messages in the analytics-service log saying it has started, and for each open index, whether it was closed because it is now past the cut-off date, or was optimized (the optimization is blindly optimizing all open, older-than-today indices, because if it is already optimized, Elasticsearch does nothing).
com.vmware.idm.analytics.elasticsearch.ElasticSearchHttpStorageAdapter - Executing analytics retention policy, cutoff date is 2019-04-07
com.vmware.idm.analytics.elasticsearch.ElasticSearchHelper - Closed index: v4_2019-04-06
com.vmware.idm.analytics.elasticsearch.ElasticSearchHelper - Optimizing index v4_2019-05-02
com.vmware.idm.analytics.elasticsearch.ElasticSearchHelper - Optimizing index v4_2019-06-28
com.vmware.idm.analytics.elasticsearch.ElasticSearchHttpStorageAdapter - Analytics retention policy completed.
Elasticsearch and RabbitMQ Health Status
Time skew
Elasticsearch will be out of sync when the WS1 Access nodes are with different times.
The easy way of checking is from the System Diagnostics Page -> Clocks - it should show all the clock times.
Check using CLI on all nodes: watch -n 1 date
Disk space
Due to default policy of never deleting old data, the /db filesystem usage will continue to grow until it runs out of space.
- Elasticsearch will stop writing documents when it get 85% full (set via the cluster.routing.allocation.disk.watermark.low setting).
- RabbitMQ will stop working when it gets down to just 250MB free (set via the disk-free-limit setting).
Check the free disk space for the /db filesystem with the command: df -h
RabbitMQ Queues
An indicator that something is wrong is if the size of pending documents in the analytics queue is growing. RabbitMQ is used for other types of messages, which go in their own queues, but the analytics queue is the only one that does not have a TTL, so it is the only one that can grow. This is done so that its’ messages never get deleted and the audit records never get lost. Typically the analytics queue should have just 1-2 messages waiting to be processed, unless something is wrong or there is a temporary spike in records being generated (during a large directory sync the queue might temporarily grow, if the system cannot keep up).
Check queue size on each node with CLI: rabbitmqctl list_queues | grep analytics
If the number reported is larger than 100, its time to investigate why.
⭐️ This is also reported as the AuditQueueSize value in WS1 Access health API: /SAAS/API/1.0/REST/system/health/
General Elasticsearch Checks
Overall cluster health:
curl http://localhost:9200/_cluster/health?pretty
Check that the node counts (number_of_nodes and number_of_data_nodes) equals the size of the cluster and the state is green (except for single nodes, whose state will always be yellow)
GREEN = good, there are enough nodes in the cluster to ensure at least 2 full copies of the data spread across the cluster;
YELLOW = ok, there are not enough nodes in the cluster to ensure HA (single-node cluster will always be in the yellow state);
RED = bad, unable to query existing data or store new data, typically due to not enough nodes in the cluster to function or out of disk space.
Check that nodes agree on which ones are actually in the cluster and who the master is (to ensure you don’t have errant nodes, or split-brain with two clusters instead of one).
Run this on each node and verify the output is the same for every node:
curl http://localhost:9200/_cluster/state/nodes,master_node?pretty
This information is also reported in the “ElasticsearchNodesCount”, “ElasticsearchHealth”, “ElasticsearchNodesList” values in the health API, but that will only be coming from one of the nodes as picked by the gateway: /SAAS/API/1.0/REST/system/health/
Other useful commands:
curl http://localhost:9200/_cluster/health?pretty=true
curl -XGET 'http://localhost:9200/_cluster/health?pretty=true'

curl http://localhost:9200/_cluster/state/master_node,nodes?pretty
curl http://localhost:9200/_cluster/stats?pretty=true
curl http://localhost:9200/_nodes/stats?pretty=true
curl http://localhost:9200/_cluster/state?pretty=true

curl http://localhost:9200/_cat/shards | grep UNASSIGNED
curl -XGET ‘http://localhost:9200/_cat/shards?h=index,shard,prirep,state,unassigned.reason’ | grep UNASSIGNED
Proactive support
Avoiding disk space issues
Determine the growth rate of data nodes can store. Use that to either schedule disk size increase, or determine how many days of data with their usage they can keep.
After a few weeks of running the system, look at the size of each index and determine the average day’s size using:
curl localhost:9200/_cat/indices?v
Extrapolate how many days nodes have space for. For safety, use 50-60% of space as the benchmark.
You can change the data retention policy to automatically delete old data so that the filesystem usage is capped. This will not interrupt service and is done by a configuration change that must be done on each node, setting the maxQueryDays to the number of days to keep data. The new policy will take affect at 00:30 am:
- Edit /usr/local/horizon/conf/runtime-config.properties on each node to add/modify the following lines:
analytics.deleteOldData=true   (default is false, close the older indices)
analytics.maxQueryDays=90      (default is 90)
- Restart the workspace service after making the change. To avoid any interruption in service, wait for the service to be fully back up before moving on to the next node:
service horizon-workspace restart
- When all nodes have been updated and restarted, pick one of the nodes and tell the cluster to re-open any old, closed indices so that the new policy will find and delete them:
curl -XPOST http://localhost:9200/_all/_open
Avoid full cluster restart issues
WS1 Access can take a long time to come up, because the first node has the default configuration of only expecting one node in the cluster and decides it is the master. Then it checks what indices it has and discovers a bunch a shards it cannot find. When the second node comes up, it is told by the first node that the first node is the master, but the first node is stuck because of the missing shards, so refuses to act like a master. The same thing happens when the third node comes up. This situation can be fixed by restarting Elasticsearch on the first node. This can be completely avoided by changing the configuration, so that on restart all the nodes know to expect more nodes in the cluster, so they wait and only elect a master when the second node comes up.
On each node, edit /opt/vmware/elasticsearch/config/elasticsearch.yml to add these lines, which tell the cluster to not form until at least 2 nodes are in communication, and to wait up to 10 minutes for a third node to come online before deciding to start copying shards between the two nodes that are there to ensure HA. It will also prevent accidentally starting Elasticsearch more than once on a node:
discovery.zen.minimum_master_nodes: 2
gateway.recover_after_nodes: 2
gateway.expected_nodes: 3
gateway.recover_after_time: 10m
node.max_local_storage_nodes: 1
❗️❗️ NOTES: ❗️❗️
- Make sure there are no leading spaces in front of the entries, otherwise elasticsearch will not start (no “initializing” message in the log).
- This should only be done for a 3 node cluster, this will break single nodes.
- A restart after applying this configuration is NOT needed, the config is only applicable when a restart is happening, so it will take affect the next time the cluster restarts.
Elasticsearch Manual Reindex
. /usr/local/horizon/scripts/hzn-bin.inc && /usr/local/horizon/bin/curl -v -k -XPUT -H "Authorization:HZN <cookie>" -H "Content-Type: application/vnd.vmware.horizon.manager.systemconfigparameter+json" https://localhost/SAAS/jersey/manager/api/system/config/SearchCalculatorMode -d '{ "name": "SearchCalculatorMode", "values": { "values": ["REINDEX"] } }'
Troubleshooting Elasticsearch and RabbitMQ
Elasticsearch cluster health returns MasterNotDiscoveredException
When you try to check the elasticsearch cluster health you get:
{
  "error" : "MasterNotDiscoveredException[waited for [30s]]",
  "status" : 503
}
You can enable additional logging by editing /opt/vmware/elasticsearch/config/logging.yml and adding the following line after the “org.apache.http: INFO” one.
com.vmware: DEBUG OR com.vmware: TRACE
Causes:
-
Stale/incorrect node entries stored in the DB being reported to Elasticsearch. Look at the contents of the “ServiceInstance” DB table. If there are any wrong entries manually delete them. Check the “status” value is 0. Any other value is indicates an issue with that node that needs to be looked at (1 = Inactive, 2 = error, 3 = invalid master key store, 4 = pending removal). When the issues with the ServiceInstance table have been addressed, within 30 seconds the elasticsearch plugin on all the nodes should now get just the correct records and sort itself out. If it hasn’t done that within a few minutes, restart elasticsearch on each node (service elasticsearch start).
-
Mis-configured multi-DC setup, resulting in the service instance REST API reporting incorrect nodes to elasticsearch. On the affected nodes check the output of:
/usr/local/horizon/bin/curl -k https://localhost/SAAS/jersey/manager/api/system/clusterInstances
If it does not show the entries you expect, look in the “ServiceInstance” table in the DB and check the “datacenterId” column value is correct for the nodes (so they are identified as part of the correct per-DC cluster. Check the “status” value is 0. Any other value indicates an issue with that node that needs to be looked at (1 = inactive, 2 = error, 3 = invalid master key store, 4 = pending removal).
Elasticsearch unassigned shards
❗️ DO NOT DELETE UNASSIGNED SHARDS
You need to address the underlying cause, then the unassigned shards will be resolved by the cluster on its own. It is extremely rare for unassigned shards to be a real issue needing direct action (eg. filesystem corruption, accidental data deletion).
Elasticsearch cluster health yellow
One of the nodes is down, unreachable or broken. Find out which one is in trouble by getting the list of nodes and seeing which one is missing:
curl http://localhost:9200/_cluster/state/nodes,master_node?pretty
Do not worry about unassigned shards in the health API output, getting the node back in the cluster will allow the master to sort out who has what shard and within minutes the unassigned shards will be resolved and the cluster green.
Causes:
-
If the node is down, bring it back up.
-
Check the node is reachable from the other nodes in the cluster. If it isn’t, fix the networking/firewall issue so that it can rejoin the cluster.
-
On the missing node, check the disk space is ok. If it’s full, either:
a. increase the size of the filesystem, OR
b. free up disk space to get the cluster back to green by manually deleting the older indices, based on their date. To do that, first stop Elasticsearch on all the nodes
elasticsearch service stop. Then delete the directories for the oldest indices in the /db/elasticsearch/horizon/nodes/0/indices directory on the node with disk space issues. When there is at least 500MB-1GB free space again on that node, delete the exact same ones on the other two nodes. Finally, restart Elasticsearch on each node service elasticsearch start and the cluster should go back to green and then you can adjust the retention policy.
Elasticsearch cluster health red
At least two of the nodes are broken, the analytics queue in RabbitMQ will start to grow.
Causes:
- Check for the same causes as the yellow health.
- All nodes are up but the master node is misbehaving. You may see messages like this in the logs of the non-master nodes where they try to connect to the master, but are refused:
[discovery.zen ] [Node2] failed to send join request to master [Node1],
reason [RemoteTransportException[[Node1]][internal:discovery/zen/join]]; nested:
ElasticsearchIllegalStateException[Node [Node1]] not master for join request from [Node2]
Determine the master node from the log (eg Node2 in the example above) or with:
curl http://localhost:9200/_cluster/state/nodes,master_node?pretty
Restart Elasticsearch on the master node service elasticsearch restart . One of the other two nodes should immediately become the master (re-run the curl on the other nodes again to verify) and the old master will re-join the cluster as a regular node when it comes up.
RabbitMQ analytics queue is large
The analytics queue size in RabbitMQ should usually only show 0-5 messages when the system is functioning correctly. If you see larger values, this means messages were not able to be delivered to elasticsearch.
Causes:
- The issue is with sending messages due to infrastructure issues. Look in the logs for error messages from “AnalyticsHttpChannel” to see if there is an issue sending (bad cert or hostname).
- The issue is with connecting to RabbitMQ. Look in the logs for messages that contain “analytics” and “RabbitMQMessageSubscriber”.
- The Elasticsearch status is yellow or red. Follow the steps above to remedy.
- It’s an old message. If the Elasticsearch status is green, look in the analytics-service log for details on why the message is unable to be processed. If you see a bulk store failure message containing “index-closed-exception”, then its because the message contains a record with a timestamp older than maxQueryDays. Allow the message to get processed by opening all the indices (the nightly data retention policy will then close any that need it again):
curl -XPOST http://localhost:9200/_all/_open
You can use following command to check the indices status:
curl http://localhost:9200/_cat/indices
The messages should now be able to get processed and the queue size should drop.
- Its a bad message. If the Elasticsearch status is green, look in the analytics-service log for details on why the message is unable to be processed. If you see a bulk store failure message containing
"parse_exception", then there is a malformed document.
-
You can clear the entire queue by executing rabbitmqctl purge_queue <queue>.
Note: This will cause the loss of any other audit events, sync logs and search records that were also queued up, so the search index must be rebuilt to ensure the search/auto-complete functionality continues to work fully.
-
You can also use the management UI to remove just the bad message. Go to the queue in the Management UI and select the “Get messages” option with re-queue set to false to pull just the first message off the queue (which should be the bad message). Once the bad message is cleared, the others should get processed successfully.
- If the queue is for replicating to a secondary DC, but are old (DNS name change, or used IP addresses (other than 127.0.0.1) instead of FQDN), then the queue must be manually deleted from each node to prevent it from continuing to accumulate messages by doing the following on each node:
a. Enable firewall access to the RabbitMQ management UI:
- Edit /usr/local/horizon/conf/iptables/elasticsearch to add “15672” to the ELASTICSEARCH_tcp_all entry, => ELASTICSEARCH_tcp_all="15672"
- Re-apply the firewall rules by executing the /usr/local/horizon/scripts/updateiptables.hzn script.
b. You can only access the RabbitMQ Management UI using the default credentials of guest/guest on localhost, so you will have to create a new admin user in RabbitMQ. To create a user called “admin” with the password “s3cr3t”:
       rabbitmqctl add_user admin s3cr3t
       rabbitmqctl set_user_tags admin administrator
       rabbitmqctl set_permissions -p / admin ".*" ".*" ".*"
c. In a browser, access the RabbitMQ Management UI by going to http://host-or-ip-of-node:15672
- log in with the newly created user
- click on the “queues” tab
- select the bad queue from the list
- select delete from the “Delete / purge” option at the bottom of the page.
d. For security, re-disable remote access to the RabbitMQ Management UI by re-doing the a) step, but removing the 15672 port: ELASTICSEARCH_tcp_all="", then re-apply the firewall rules with the updateiptables.hzn script.
Diagnostics Page or Health API shows “Messaging Connection Ok: false”
This means RabbitMQ is in a bad state. Causes:
- Out of disk space. Check the RabbitMQ status and compare the
"disk_free_limit" and "disk_free" values to verify:
See cause #3 in the “Elasticsearch cluster health yellow” section for the steps to free up disk space.
- Recovery file corruption, possibly due to an abrupt power off/failure on the VM See Article
RabbitMQ is not able to start, i.e. rabbitmqctl status gives a “nodedown” error and you see this error in /db/rabbitmq/log/startup_log:
      BOOT FAILED ... {error, {not_a_dets_file,
      "/db/rabbitmq/data/rabbitmq@<YOUR_HOSTNAME>/recovery.dets"}}}
This will require deleting the recovery file and starting RabbitMQ again:
a. Stop all RabbitMQ processes by doing kill -9 on all processes found with ps -ef | grep -i rabbit, until none remain.
b. rm /db/rabbitmq/data/rabbitmq@<YOUR_HOSTNAME>/recovery.dets
c. rabbitmq-server -detached &
Once RabbitMQ is running again, workspace should be able to connect to it.
Note, it may take up to 10 minutes before re-connection is tried. Look in horizon.log for messages from RabbitMQMessageSubscriber and RabbitMQMessagePublisher. If you see messages that indicate they were shutdown instead of connected or there are ProviderNotAvailableExceptions in the log, then workspace must be restarted service horizon-workspace restart to recreate them.
New/changed users or groups are not showing up in the search or assign to application boxes
- Ensure the cluster is healthy and all the nodes agree on the who is in the cluster and who the master node is by following the steps in “Elasticsearch Cluster Health” above;
- Ensure RabbitMQ queue size is not large, indicating messages containing the changes are undelivered to elasticsearch;
- If, after addressing any issues found with the previous checks, trigger a re-index of the search data.
❗️❗️ DO NOT USE UNLESS NOTHING ELSE HELPS ❗️❗️
Option 1
Stop elasticsearch on all nodes, delete the data in elasticsearch and RabbitMQ, restart the elasticsearch process on each node, and trigger a re-index. This will result in the loss of the historic sync logs and audit data.
NOTE: If this is a Multi-Site setup:
- Only steps 1-6 should be done on the DR site first (don’t do step 7, the reindex, it should ONLY to be done on the primary site, the results of that will then get replicated over to the DR site.).
- When the DR site is OK, perform all 7 steps on the PRIMARY site.
Step 1. Stop elasticsearch on every node in the site:
service elasticsearch stop
Step 2. When stopped on all nodes, clear the data, by doing the following on each node:
rm -rf /db/elasticsearch/horizon
rm -rf /opt/vmware/elasticsearch/logs
//so we start with fresh logs to make it easier to see what is happening.
Get the analytics queue name(s) and purge them. On the primary site there should be two analytics RabbitMQ queues that need purging, one for 127.0.0.1 ("-.analytics.127.0.0.1") and one for the DR site (as configured via the analytics.replication.peers setting in the runtime-config.properties file, “-.analytics.dr.site.com”):
  rabbitmqctl list_queues | grep analytics
  rabbitmqctl purge_queue <analytics-queue-name>
Step 3. Verify the data retention policy configuration on each node is the same by looking at the /usr/local/horizon/conf/runtime-config.properties file and the “analytics.maxQueryDay” and “analytics.deleteOldData” values. If any node is different, then change them to match and restart WS1 Access on the node that did not match with:
service horizon-workspace restart
Wait for WS1 Access to be back up before restarting another and before going on to step 4.
Step 4. Add the additional config to Elasticsearch from the above chapter “Avoid full cluster restart issues” preventative measure to help it recover from a full cluster restart, by adding these lines to /opt/vmware/elasticsearch/config/elasticsearch.yml on each node if missing:
   discovery.zen.minimum_master_nodes: 2
   gateway.recover_after_nodes: 2
   gateway.expected_nodes: 3
   gateway.recover_after_time: 10m
Step 5. Restart elasticsearch on each node (preferably quickly)
service elasticsearch start
Step 6. Verify the cluster is functioning fully by running the following on each node and making sure the results match (ie, nodes are 3, same master and the node list is the same) and health is green:
  curl http://localhost:9200/_cluster/state/nodes,master_node?pretty
  curl http://localhost:9200/_cluster/health?pretty
If the output for those two commands do not match on all nodes stop, do not proceed to step 7. Gather the logs in /opt/vmware/elasticsearch/logs for each node.
STEP 7. Trigger a re-index of the search data.
To manually force a re-index, choose either the zero-down time option if you’re comfortable finding the HZN cookie value, or the down-time option by modifying the value directly in the DB.
The re-index should only take a few minutes. You can verify it started by looking in the workspace horizon.log for a message like:
com.vmware.horizon.search.SearchCalculatorLogic -
Keep existing index. Search calculator mode is: REINDEX
Zero down-time
- Log in to VIDM as the operator/first admin.
- Use the developer tab in your browser to find the cookies (eg for Firefox, select Web Developer→Network. Then load a page and select the first request. Then select the “Cookies” tab and scroll down to the HZN cookie).
-
Copy the value of the HZN cookie.
-
ssh into a node make the following REST API call, replacing <cookie_value> with the HZN cookie value obtained from the browser.
. /usr/local/horizon/scripts/hzn-bin.inc && /usr/local/horizon/bin/curl -k -XPUT -H "Authorization:HZN <cookie_value>" -H "Content-Type: application/vnd.vmware.horizon.manager.systemconfigparameter+json" https://localhost/SAAS/jersey/manager/api/system/config/SearchCalculatorMode -d '{ "name": "SearchCalculatorMode", "values": { "values": ["REINDEX"] } }'
After initiated “REINDEX”, you can change the log to confirm it is started
cat /opt/vmware/horizon/workspace/logs/horizon.log | grep REINDEX
With down-time
Stop horizon-workspace on all nodes: service horizon-workspace stop
Edit the DB:
UPDATE "GlobalConfigParameters" SET "strData"='REINDEX' WHERE "id"='SearchCalculatorMode';
Restart horizon-workspace on all nodes: service horizon-workspace start
Verify progress
The reindex should start within a couple of seconds. Verify the reset was successful by looking for the message “Forcing a REINDEX of the search index” in the logs.
Reindexing can take hours, depending on the size of the data. You can monitor its progress by looking in the logs for “SearchCalculatorLogic” statistic messages, which show the counts of the objects its currently processing (typically it will be 5000 at a time when doing a re-index). When the all counts reach zero, it means it has finished. eg:
2020-02-28T05:54:08,208 WARN (pool-37-thread-2) [ACME;-;-;-]
com.vmware.horizon.common.datastore.BaseCalculator - ++SearchCalculatorLogic$
$EnhancerBySpringCGLIB$$3e4c8f8c [ 0] 0.000000/Object ([ 0] 0.000000/Group, [ 0] 0.000000/Users,
[ 0] 0.000000/ResourceDb)
Option 2
Re-Doing the Elastic Search Index.
Symptom: in case the user/group search is not working properly.
Resolution:
Stop workspace service (on all nodes):
service horizon-workspace stop
- For User Entitlement:
update saas.GlobalConfigParameters set "strData"=-1 where "id"= 'LatestUserEntitlementVersion’;
For Search:
update saas.GlobalConfigParameters set "strData"=-1 where "id"= 'LatestSearchVersion’;
For User Group association:
update saas.GlobalConfigParameters set "strData"=-1 where "id"= 'LatestUserGroupVersion’;
- Start service (on all nodes):
service horizon-workspace start
Mobile SSO - iOS
External Links:
❗️❗️ Do NOT use UAG in front of WS1 Access with MobileSSO for iOS scenario!
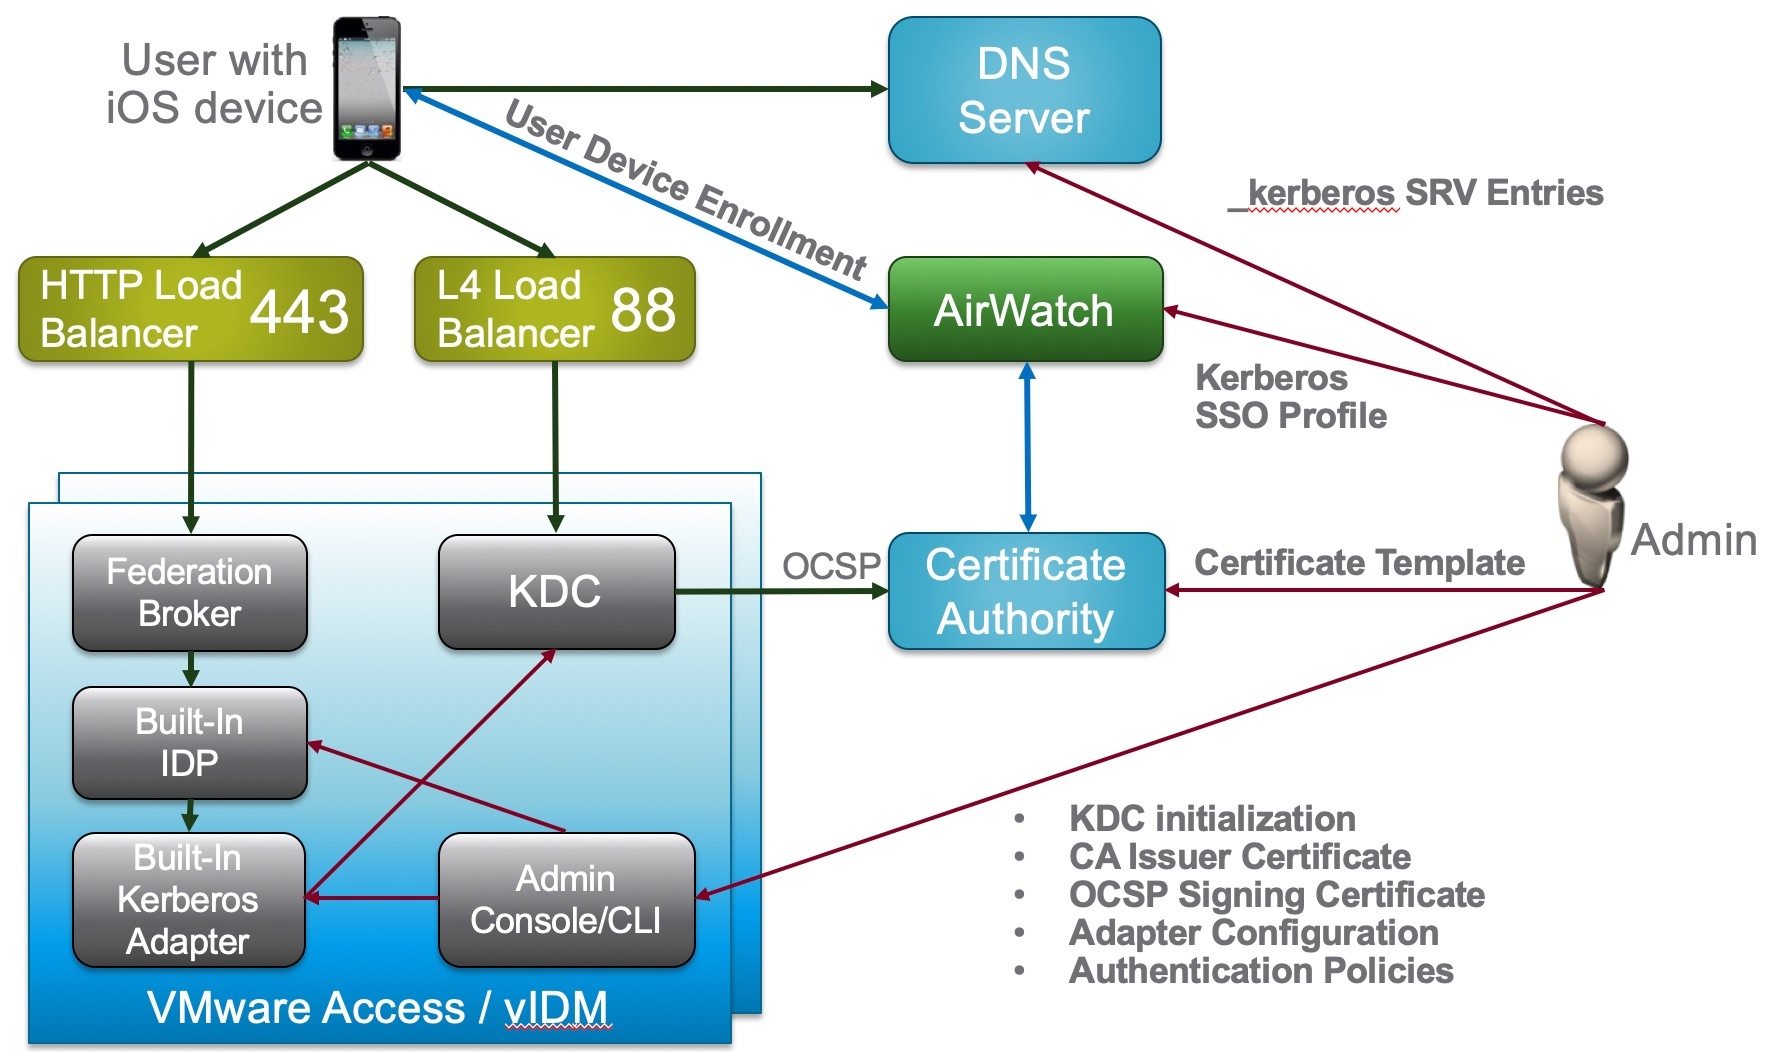
Schema


Configuation Logic
ADMINISTRATOR CONFIGURATION
- Following the red lines, the Administrator is going to configure REALM DNS entries (for on-premises only).
- The admin will configure the Certificate Authority as well as the Cert templates and get the CA Cert for uploading into AirWatch and IDM.
- The admin will configure AirWatch with the Cert Authority configurations, including setting up the certificate template and device profiles for pushing certificates.
- Finally the admin will configure Identity Manager via the Admin Console to setup the Built-In Kerberos adapter and KDC with Cert Authority CA Root Certs from both AirWatch admin and Certificate Authority as necessary. Additionally, the admin will configure the Built-In IDP and authentication policies within Identity Manager to properly use the CA and Device certificates delivered through AirWatch to the end device.
USER ENROLLMENT
- Next the user will enroll the device with AirWatch.
- The enrollment request to AirWatch will request a device certificate from the Certificate authority.
- The certificate bundle will be delivered back to the device during the completion of the enrollment.
- Additionally, any native AirWatch applications such as Workspace ONE and other apps will be pushed to the iOS device.
USER APP LAUNCH
- User launches application such as SalesForce. This requests gets passed down via TCP 443 through the load balancer, and hits the Built-In IDP and Built-In Kerberos Adapter. The Authentication Policy responds with the type of authentication it is expecting to see (i.e. Built-In Kerberos). This is passed back to the iOS device within a token which then tells the device to authenticate to a specific REALM.
- The iOS device then does a REALM lookup against DNS and gets the specific KDC server it should authenticate against.
- The iOS device requests authentication via TCP 88 to the KDC server, sending the Device certificate to the KDC, which then responds with an authentication approval.
- Once IDM receives the authentication approval, the app launches on the iOS device and the user goes about their day.
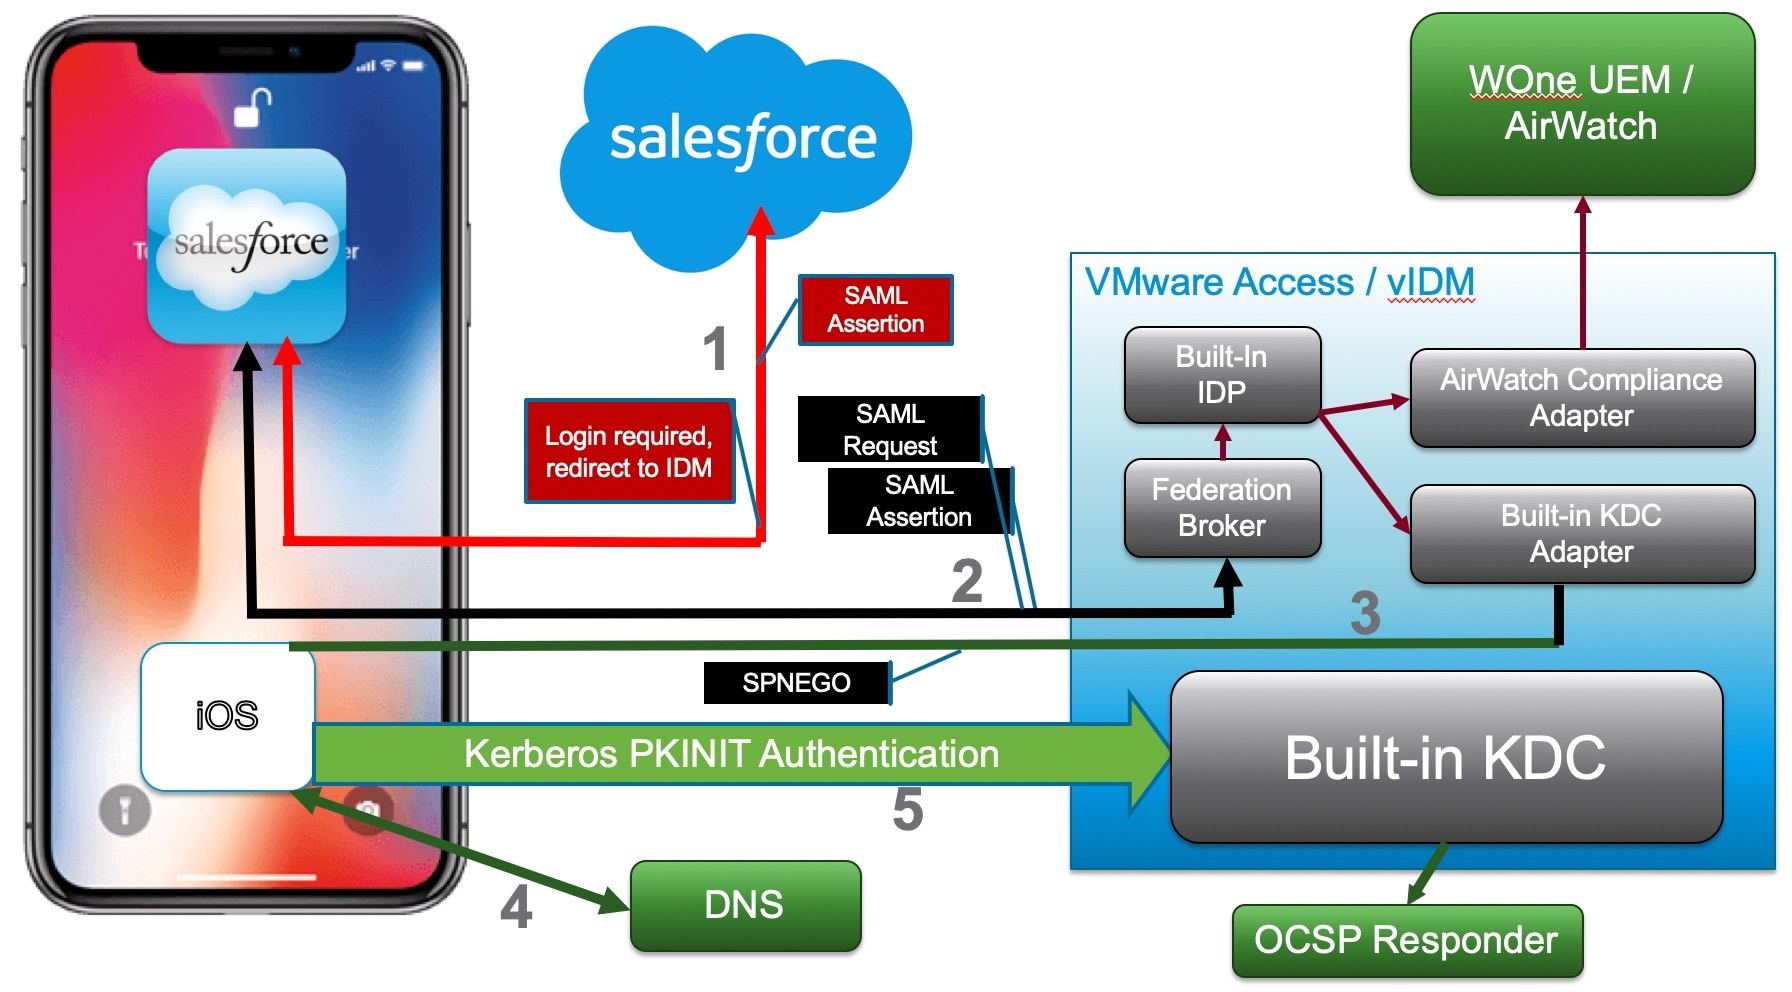
iOS Login Flow


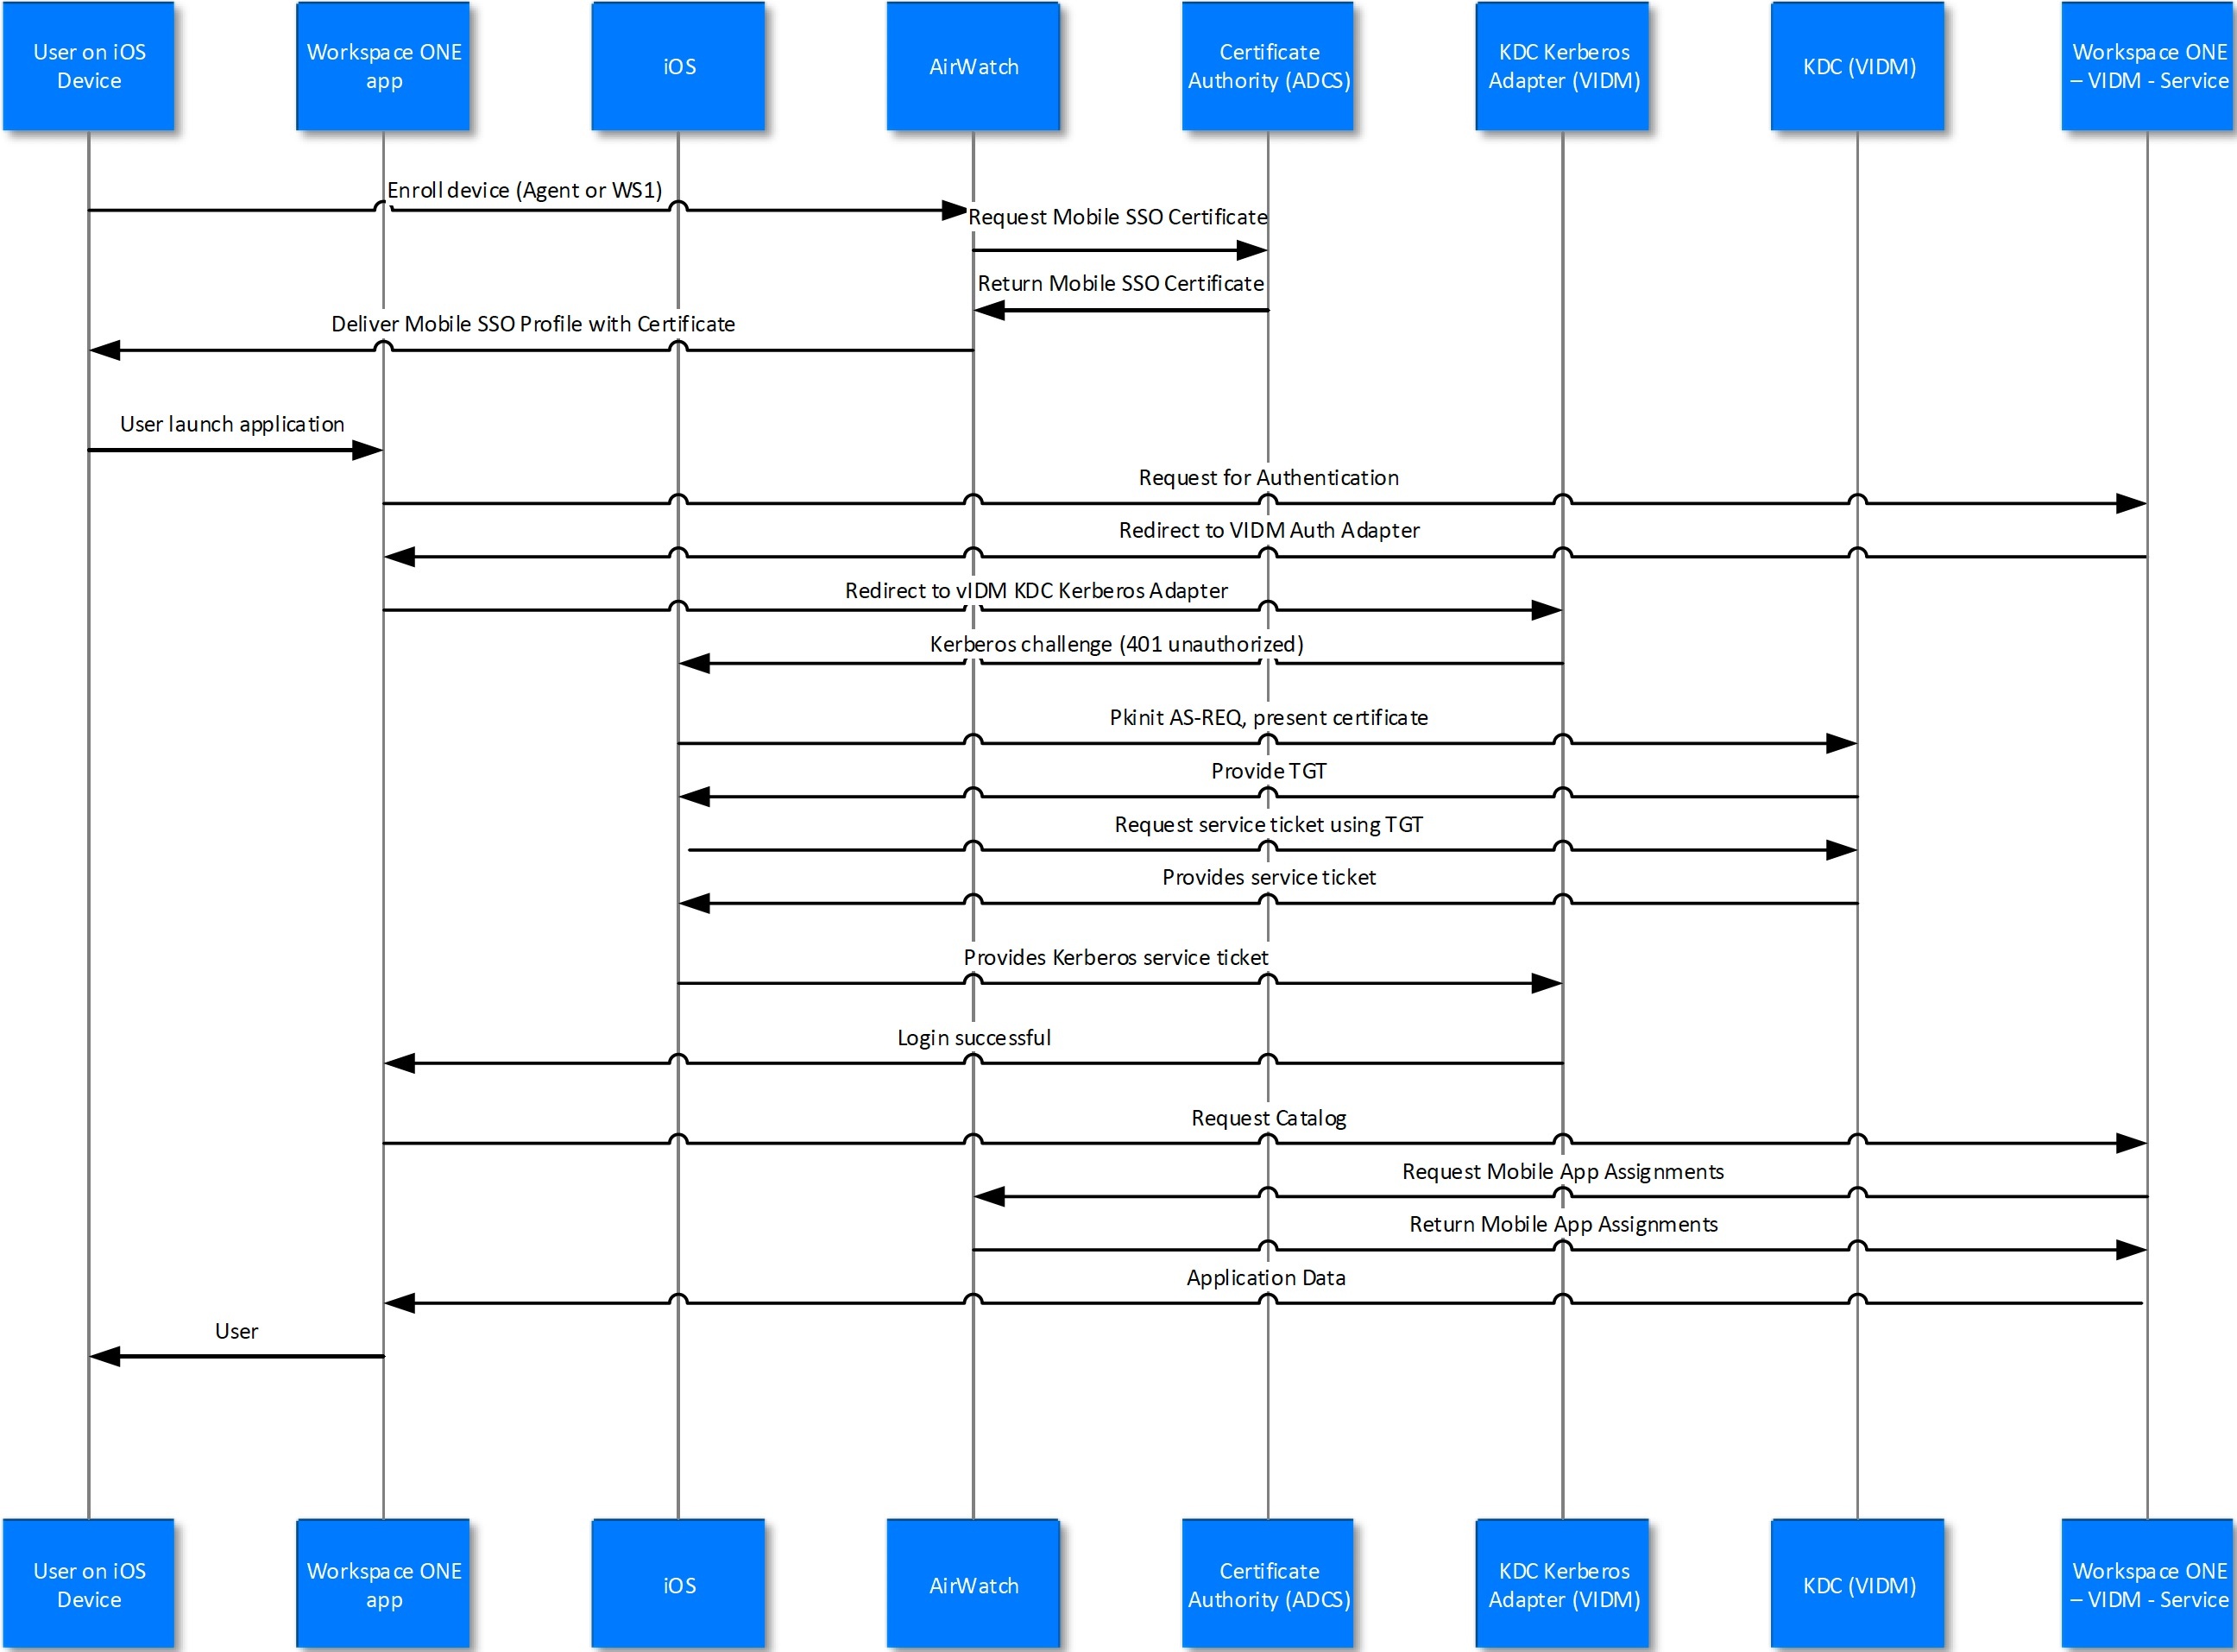
Login Flow Steps:
- Managed iOS device is deployed with Kerberos SSO profile, a user certificate and a vanilla SalesForce app.
- SalesForce.com has been configured to use Access/vIDM for authentication using SAML.
- On launch, the salesforce app connects to salesforce.com and is redirected to VMware Access/vIDM.
- Access/vIDM evaluates the authentication policy and determines that built-in KDC authentication should be used for the request. The built-in KDC adapter sends a SPNEGO 401 response to the device.
- iOS on the device intercepts the response and performs Kerberos PKINIT authentication using the certificate. An OCSP check can optionally be configured. This results in the device receiving a Kerberos service ticket which is submitted to the IDM built-in KDC adapter in an Authorization header.
- The built-in KDC adapter validates the ticket and completes the authentication on IDM. The UUID is extracted from the ticket and optionally verified with WOne UEM / AirWatch.
- Upon successful completion of all checks, a SAML assertion is generated and sent back to the salesforce.com app.
- The salesforce app can then present the SAML assertion to SalesForce.com and get logged in.
DNS
Given L4 Load Balancer at 1.2.3.4 and a DNS domain of example.com and a realm of EXAMPLE.COM:
kdc.example.com. 1800 IN AAAA ::ffff:1.2.3.4
kdc.example.com. 1800 IN A 1.2.3.4
_kerberos._tcp.example.com. IN SRV 10 0 88 kdc.example.com.
_kerberos._udp.example.com. IN SRV 10 0 88 kdc.example.com.
❗️ There MUST be an IPv6 AAAA entry - iPhone requires it to work correctly.
AAAA entry may have to be converted to IPv6 format: :::::ffff:102:304
⭐️ Use web-tool: https://www.ultratools.com/tools/ipv4toipv6
Troubleshooting DNS records
To test the DNS settings, you can use the dig command (built-in to Mac and Linux) or NSLOOKUP on Windows.
Here is what the dig command looks like for DNS records:
dig SRV _kerberos._tcp.example.com
dig SRV _kerberos._udp.example.com

# You may wish to define the name server to use with dig by using the following command:
dig @ns1.no-ip.com SRV _kerberos._tcp.example.com
Use Google Toolbox to check the SRV entries:
https://toolbox.googleapps.com/apps/dig/#SRV/_kerberos._tcp.example.com
The result must contain string of type:
;ANSWER
_kerberos._tcp.example.com. 3599 IN SRV 10 0 88 krb.example.com.
Use NC to check UDP/Kerberos services:
nc -u -z kdc.example.com 88

# Answer:
#> Connection to kdc.example.com port 88 [udp/kerberos] succeeded!
Use nslookup to check the SRV entries:
nslookup -q=srv _kerberos._tcp.vmwareidentity.eu
Server:		10.26.28.233
Address:	10.26.28.233#53

Non-authoritative answer:
_kerberos._tcp.vmwareidentity.eu	service = 10 0 88 kdc.vmwareidentity.eu.
Certificates


CA Requirements (including CloudKDC)
Mobile Device Profile
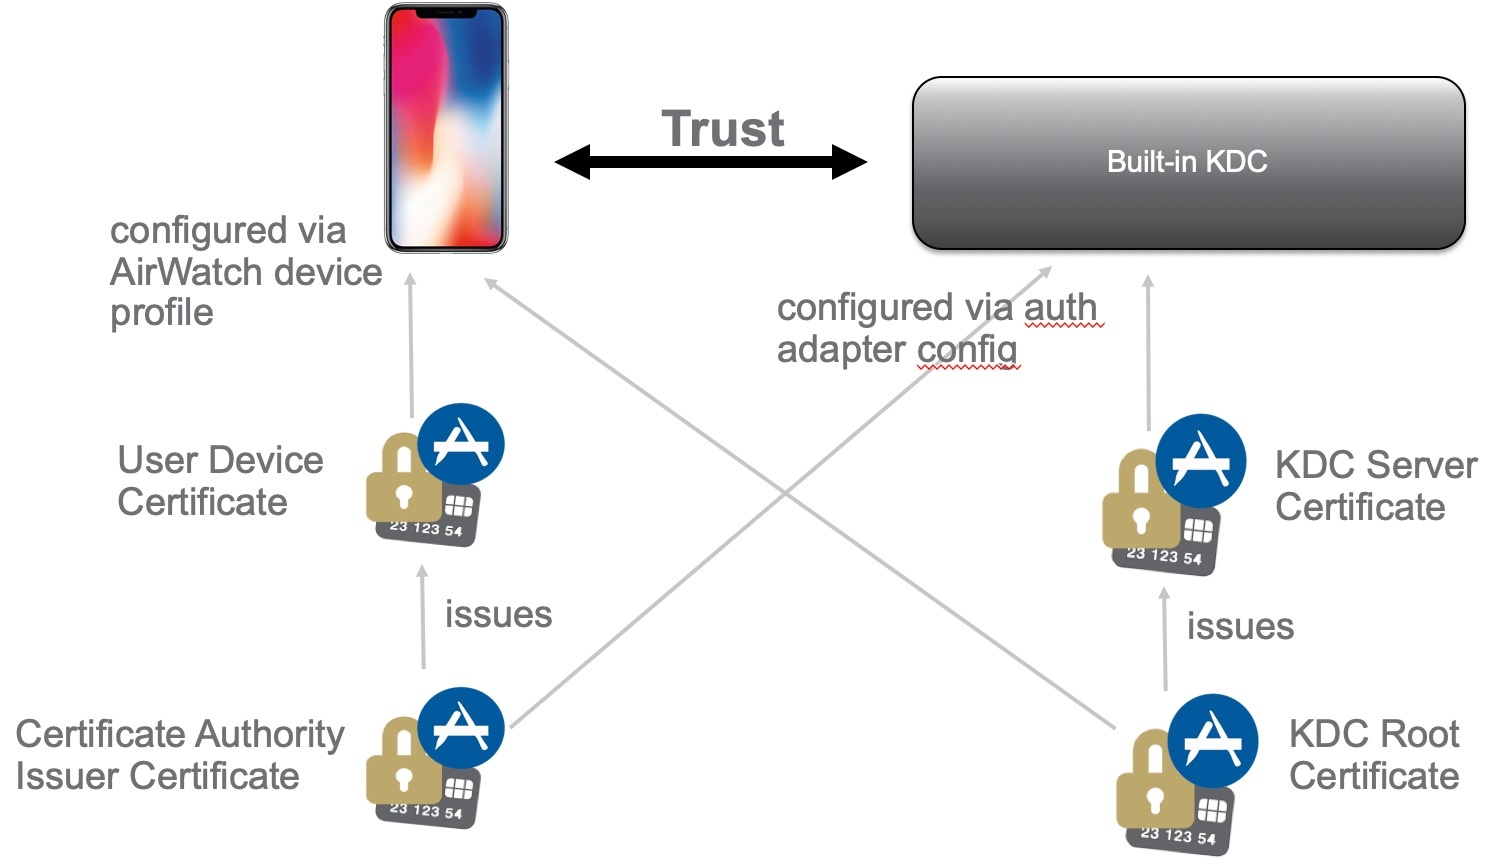
The mobile device profile for the Cloud KDC feature must include the following:
- Add KDC server root certificate from previous step to credentials
- Add credential for Certificate Authority issued certificate
- Configure the SSO profile
- A user principal name that does not contain an “@” symbol, i.e., it is is typically set to “{EnrollmentUser}".
- The realm name that identifies the site where the tenant is deployed. This is the domain name for the site in upper case, e.g., VMWAREIDENTITY.COM.
- Specify the Kerberos principal name: {EnrollmentUser}
- Specify the certificate credential
- Specify the URL List: https://tenant.example.com/
- The URLPrefixMatches value in the Kerberos dictionary in the com.apple.sso payload type must include https://tenant-vidm-url/ where “tenant-vidm-url” is the FQDN of the tenant’s WS1 Access address. Note that this FQDN may be different than the one that is used for the realm, e.g., workspaceair.com vs. vmwareidentity.com.
Specify a list of app bundle ids:
- com.apple.mobilesafari (enables access from the Safari browser)
- com.apple.SafariViewController (enables apps that use Safari View Controller)
- com.air-watch.appcenter (enables the Workspace ONE native app)
OCSP Requirements
The CA OCSP responder must be accessible on the Internet so that it can be accessed by the KDC. The URL for the OCSP responder is provided in the client certificate in the usual manner.
WS1 UEM has confirmed that the AW CA will meet this requirement.
KDC in vIDM Schema (old)
Port 88 must be open TCP+UDP. Use packet sniffer to check packets from device.


Enable KDC
For a single Workspace ONE environment or primary domain:
/etc/init.d/vmware-kdc init --realm MY-IDM.EXAMPLE.COM
# Restart horizon-workspace service:
service horizon-workspace start
# Start KDC service:
service vmware-kdc start
Full instructions link
Reinitialize the KDC
Login to the console (or SSH and SU to root) and do the following:
a. Stop the vmware-kdc service
b. Force reinitialization of the KDC service (note the use of the ‘–force’ switch at the end)
c. Restart the vmware-kdc service
d. Restart the horizon-workspace service
⭐️ Last 2 steps can be replaced with rebooting the appliance.
service vmware-kdc stop
/etc/init.d/vmware-kdc init --realm EXAMPLE.COM --subdomain idm.example.com --force
service vmware-kdc start
service horizon-workspace restart
#Or just type reboot to restart the appliance.
Enable KDC using subdomain
This is useful for multiple Workspace ONE environments (Prod, UAT, DEV). Remember that realm must be all CAPs and subdomain is all lowercase.
/etc/init.d/vmware-kdc init --force --realm SUBDOMAIN.IDM.DOMAIN.COM --subdomain subdomain.idm.customer.com- Restart horizon-workspace service:
service horizon-workspace start
- Start KDC service:
service vmware-kdc start
Flags:
–force (force init erasing previous initialized KDC)
–realm (by convention, this is all caps, this is the Kerberos realm and is usually the DNS domain of the customer. It can also be a DNS sub domain if the customer needs to have multiple Kerberos realms for multiple systems
–subdomain (this is not related to subdomain in the conventional sense. This should be your WS1 Access FQDN that the end users use)
Change KDC using subdomain
Please be aware that this procedure is unnecessary if the vmware-kdc init command is run with the correct values in the first place. If a reinitialization is necessary, then there are two better options.
If the KDC CA cert doesn’t have to be maintained, then just run vmware-kdc init --force with the right arguments, or
If the KDC CA cert does need to be maintained (so that the WS1 UEM profile doesn’t have to be updated), then copy the kdc-cacert.pem, kdc-cert.pem, and kdc-certkey.pem files from /opt/vmware/kdc/conf to a temporary area, make them readable by the horizon user, and then run vmware-kdc init --force but use the arguments that allow the certs to be passed in (–kdc-cacert, –kdc-cert, and –kdc-certkey).
How to update kdc subdomain without regenerating certificates
Navigate to the kdc-init.input file and change the subdomain there to the new value
service vmware-kdc updateservice vmware-kdc restart- Enter command
/etc/init.d/vmware-kdc kadmin
- Next command:
addprinc -clearpolicy -randkey - requires preauth HTTP/(insertnewsubdomain)
- Next command:
ktadd -k kdc-adapter.keytab HTTP/(insertnewsubdomain)
- Next command:
listprincs
- You should see the HTTP/(newsubdomain) after the listprincs command. This confirms a successful update of the subdomain.
Old Windows-based IDM
Windows VIDM uses the cloud KDC which only requires the appliance to reach outbound on 443 and 88. The clients also need to be able to reach outbound on 443 and 88.
REALM used in WS1 UEM and in Windows VIDM is: OP.VMWAREIDENTITY.COM
Troubleshooting MobileSSO for iOS
Reasons for failure
- The device isn’t enrolled
- The device is enrolled but cannot access port 88 on the VIDM service
- Response from port 88 on the VIDM service cannot reach device
- DNS entries not configured correctly
- The device is enrolled but the profile has the wrong realm
- The device is enrolled but doesn’t have a certificate in the profile
- The device is enrolled but has the wrong certificate in the profile
- The device is enrolled but the Kerberos principal is wrong
- The certificate SAN values cannot be matched with the Kerberos principal
- The device is enrolled but the KdcKerberosAuthAdapter has not been configured with the issuer certificate
- The device is enrolled but the user’s certificate has been revoked (via OCSP)
- The device is enrolled but doesn’t send the certificate during login
- The device is enrolled but the app bundle id for the app isn’t in the profile
- Time is not synced between device and KDC (this will cause the TGT to be issued and a TGS_REQ to be made, but the device will reject the service ticket and asking for an “http/fqdn” ticket)
- Time is not synced between KDC nodes (this will cause save of adapter settings to fail)
- KDC subdomain value is set incorrectly (this causes the TGS_REQ to be rejected)
General checks
-
What is not working?
- Unable to save Mobile SSO for iOS adapter settings
- Is the error message “Checksum failed”?
- Is this a cluster?
- How was the data copied from one node to another? / Was “vmware-kdc init” run on multiple nodes?
- Use dump/load to replicate the data to all nodes rather than running init on all nodes.
- Device cannot login via Safari
- Device cannot login via Workspace ONE app
- Device cannot login via some other native app
- Is the app bundle id included in the profile
- Does the app use Safari View Controller?
- Is com.apple.SafariViewController included in the list of app bundle ids in the profile?
-
If the device cannot login, why is the login failing?
- Device makes no request at all to the KDC
- vIDM policy not setup correctly
- Device cannot reach the KDC
- DNS lookup issue
- Networking issue with reaching the KDC
- AS_REQ received but certificate isn’t validated
- Does the certificate have acceptable SAN values?
- Is OCSP used?
- Is the OCSP server reachable?
- Is the OCSP server validating the certificate?
- TGT issued but TGS_REQ not issued
- Is the subdomain set correctly
- Is the service ticket ignored by the device
- Is the time on the KDC service sync’d with the device?
-
Is it failing for all devices or just a subset or one device?
-
What version of iOS is being used?
- iOS 9.3.5 is known not to work for Safari
- iOS 10.3.3 has a known issue with native apps that use SafariViewController
-
Can iOS device reach the KDC? (use sniffer to check)
- There may be a networking issue. Sometime firewalls or load balancers do not pass through UDP and TCP traffic on port 88
-
Are the DNS SRV entries set up correctly?
-
Is the subdomain value for the on-premises KDC set correctly?
-
If using Hybrid KDC, does registration fails to save the adapter configuration?
- Is the vIDM service node able to resolve the _mtkadmin._tcp. SRV entry?
- Is the vIDM service node able to reach the https://hybrid-kdc-admin./mtkadmin/rest/health URL?
- Is the vIDM service node able to reach UDP port 88 for the KDC?
- Are responses from the KDC with source UDP port 88 able to reach the vIDM service node?
-
Is the AirWatch tunnel being used?
- Is the tunnel bypassing port 88 traffic to allow it to reach the KDC?
-
Is REALM domain in KDC and DNS all CAPITAL LETTERS, and subdomain all lower letters?
-
If you are using {Enrollment User} as the Kerberos principal in the device profile and {Enrollment User} is mapped to the sAMAccountName, and the sAMAccountname does not match the first portion of the user’s UPN – which is everything before the @ sign – then mobile SSO will fail.
-
For certificate authentication to work (Android SSO included), UserPrincipalName value in SAN needs to be set to user’s UPN or Email, in user’s certificate or SAN must have user’s email if UPN is missing.
-
When creating the certificate template in ADCS - use the KerberosAuthentication template with the following modifications: change the template name, change Subject Name to accept it from the request, add a new “Kerberos Client Authentication” auth policy (oid=1.3.6.1.5.2.3.4), add the AirWatch service account to the list of users that can use the certificate.
❗️The authentication policy oid must be exactly as specified
WS1 Logs
Built-in Kerberos adapter log: /opt/vmware/horizon/workspace/logs/horizon.log
KDC logs: /var/log/messages log and grep for ‘pkinit’ to see the errors returned.
grep -i 'pkinit' /var/log/messages
This may return errors like vmw_service_matches_map: “HTTP/idm.test.ws@TEST.WS” is not a match for the service_regex and Server not found in Kerberos database. Basically, either DNS is not correct or built-in KDC Server is not properly initialized.
How to Enable Kerberos iOS Device Logs to troubleshoot Mobile SSO
When having issues troubleshooting Mobile SSO for iOS, install the GSS Debug Profile on the device to retrieve more verbose Kerberos logs.
- Copy this config file to your desktop.
- Email the config file to the device.
- From the device, tap on the attachment, tap on Install. Enter the device passcode when prompted.
- Tap on Install in the upper right on the Apple Consent notification.
Link: https://developer.apple.com/services-account/download?path=/iOS/iOS_Logs/Enterprise_SSO_and_Kerberos_Logging_Instructions.pdf
❗️Action requires Apple Dev Account!
