Large-Scale Performance

Large-Scale Performance Tweaks

For 75000+ devices (iOS, Android & Windows Desktops)

Linked Articles

Attached Documents (pdf)

Test Report 1811 - 75k devices Test Report 1907 - 1.2mln devices Test Report 1907 (500k devices) Test Strategy 1902 UI Test 1902 Sizing Topology - 1mln devices

SQL

See SQL Database page for base tweaks on MS SQL.

  • Add 1 tempdb file per core (20 tempdb files for 20 core)

Each tempdb data file with below parameters: - Initial Size: 16000 MB - Autogrowth: 512 MB

USE [master];
GO
ALTER DATABASE [tempdb] ADD FILE (NAME = N'Temp1', FILENAME = N'H:\TempDBs\Temp1.ndf', SIZE = 8GB , FILEGROWTH = 512);
ALTER DATABASE [tempdb] ADD FILE (NAME = N'Temp2', FILENAME = N'H:\TempDBs\Temp2.ndf', SIZE = 8GB , FILEGROWTH = 512);
ALTER DATABASE [tempdb] ADD FILE (NAME = N'Temp3', FILENAME = N'H:\TempDBs\Temp3.ndf', SIZE = 8GB , FILEGROWTH = 512);
GO
  • Add below Trace flags in Startup Parameters for “mssqlserver” service as per Microsoft recommendations:
    T174 - https://support.microsoft.com/en-us/help/3026083/fix-sos-cachestorespinlock-contention-on-ad-hoc-sql-server-plan-cache 
    T834 - https://support.microsoft.com/en-us/help/920093/tuning-options-for-sqlserver-when-running-in-high-performance-workloads
    T3247 - https://support.microsoft.com/en-us/help/3216543/workloads-that-utilizemany-frequent-short-transactions-in-sql-server
  • Set “Lock Pages in Memory” privilege for the service account
    Open Windows Local Group Policy Editor
    Open Computer Configuration > Windows Settings > Local Policies > User Rights Assignment, find Lock Pages in Memory
  • Disable “Named Pipes” and Enable “TCP/IP” network protocol
    Open SQL Server Configuration Manager tool
    Open SQL Server Network Configuration > Protocols for MSSQLSERVER, set Named Pipes to Disabled, set TCP/IP to Enabled
  • Increase Maximum Worker threads in server properties to “7500”
    Open Server Properties from SSMS and go to Processors tab, find Maximum Worker threads field
  • Set “Max Degree Of Parallelism” to 2 and “Cost threshold for Parallelism” to 50
    Open Server Properties from SSMS and go to Advanced tab, Parallelism section in the right pane
  • Enable “Received Side scale” setting for Network Adapter on SQL server
    Run DEVMGMT.msc from CMD
    Expand Network adapters, right click on your adapter and select Properties
    Select the Advanced tab and find Receive Side Scaling. Set this to Enabled
  • Set “Delayed Durability” under database properties = “Forced” to reduce WriteLog waits
    Open Database Properties from SSMS and go to Options
  • Update “Minimum and Maximum Server Memory” allocation in Server Properties
    Open Memory from SSMS → Server Memory Options section
    • Minimum Server Memory (in MB): 256000
    • Maximum Server Memory (in MB): 1500000

Performance Tweaks

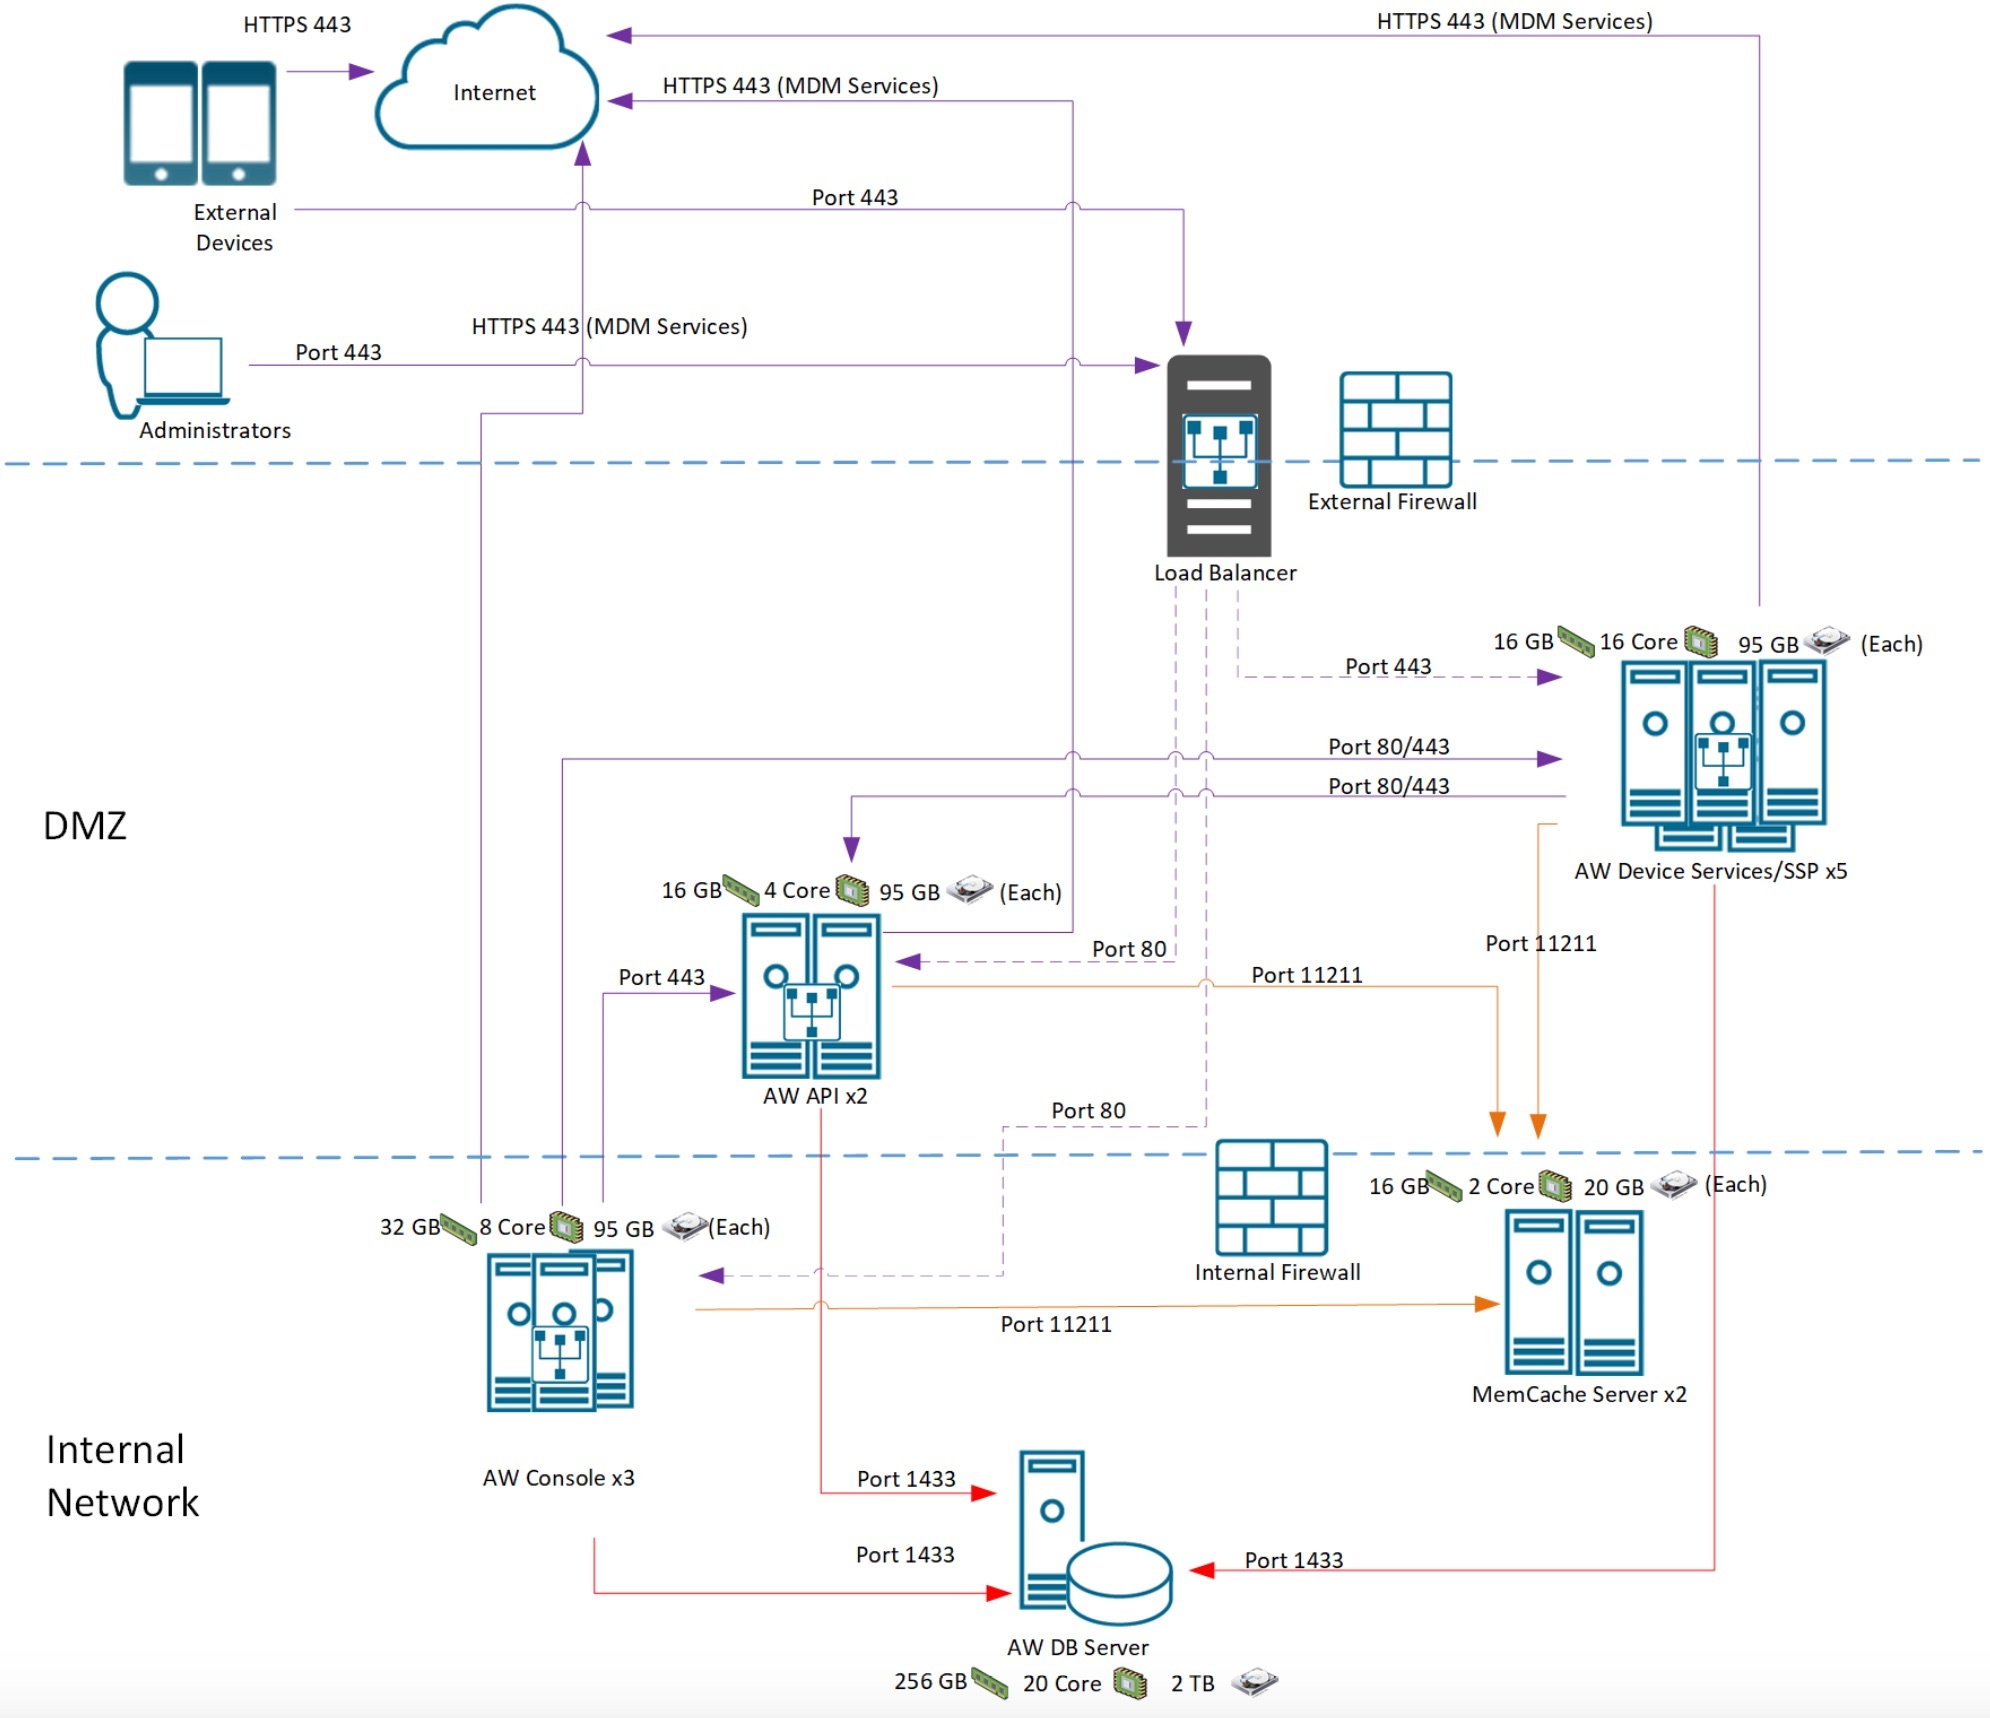
Example Architecture

  • Update Workspace ONE UEM application server to latest version

In WS1 UEM Console go to Settings > Installation > Performance Tuning:

  • Set Certificate Profile Publish Frequency: 100
  • Set Apple Profile Installation Batch Size: 300
  • Set iOS Device Invites Per Second: 30
  • Set FastLaneMessageRateMultiple: 1.5
  • Run Real-Time Compliance is set to Disabled

Check Windows Sample Frequency (for managing Windows Desktops):

  • Go to Settings > Devices & Users > Windows > Windows Desktop > App Settings
  • Go to Settings > Devices & Users > Windows > Windows Desktop > Windows Sample Schedule
  • Override the default value in Systemcode table for FastLaneMessageRateMultiple to 1.5 by updating Systemcodeoverride table in DB.
  • Add the below config to AW.Send.Messaging.Service.exe.config file in Services folder of all console servers under appSettings:
<add key="WnsMessageProcessingRate" value="10" />
<add key="WnsMessageThrottlingEnabled" value="true" />

Subsections of Large-Scale Performance

Certificate Batching

Note

This logic is only applicable for profiles that contain certificates issues through a defined Certificate Authority (CA) in the AirWatch Console.

Prior to the certificate batching logic, when a defined-CA profile is published to a large number of devices, it can result in significant performance issues on Airwatch Cloud Connectors in the AirWatch environment.  This is due to the extra processing required to issue each device a certificate from the CA, as well as the normal processing required to push the profile to the device.  The performance issues generally lead to CPU spikes and high memory usage on ACC or DS (if no ACC is configured) servers because:

  • Certificate generation is a CPU intensive task. Too many concurrent certificate generation requests spike the CPU usage.
  • Certificates are stored in memory of the process (w3wp - devicesservices) so that they can be reused for the same device.

AirWatch 7.1+ has certificate batch logic to throttle the deployment of all defined-CA profile publish jobs. These profile publish jobs will be broken into multiple batches at the environment level and a next batch will only be executed if the previous batch has been completed. 

Certificate Batching Logic

The deployment of defined-CA certificate profiles will follow the steps outlined below:

  • AirWatch Administrator publishes a profile that contained a defined CA certificate
  • Install profile commands are queued for all assigned devices in the Device Command Queue in the AirWatch Database.  These commands are queued in the Held status.  Commands in the Held status will not be processed by devices.
  • A ProfilePublishBatchJob is created to process these commands.
  • The ProfilePublishJobScheduler selects a batch and batch size, based on the settings configured in the AirWatch Console (under Settings → Installation → Performance Tuning for On-Premises environments).
  • A batch detail entity is inserted into the AirWatch DB; the mobilemanagement.CommandQueueHeldBatch_Update stored procedure is called to “release” a number of the Install Profile commands that are currently in the Held status.  The number released will be equal to or less than the overall batch size.
  • Periodically, more batches of the Install Profile command will be released until all commands are active (or have successfully been issued to devices).  Three scenarios are outlined below that describe this step in more detail.  This time period is defined by the Profile Publish Batch Job in the AirWatch Scheduler (Settings → Admin → Scheduler for On-Premises environments).

In SaaS and on-premise environments, the default Batch Size is set to 50, and the Profile Publish Batch Job interval is set to 3 minutes.

Scenario 1: All devices are consistently active

  • Devices=24000
  • Batch size=200

When a profile is published, all 24000 commands are queued in the Held status (status = 7).  The scheduler released the first 200 commands based on the batch size.  The commands are sent to devices (through APNs/Firebase), and devices consume the commands and install the profile.  At the interval defined by the Profile Publish Batch Job, the system will view how many pending install commands are still active.  As all devices are currently active and check in regularly, all of the previously queued commands will be processed, and another batch of 200 will be released.  This process repeats until all 24,000 install commands are released.

Scenario 2: Devices frequently check in (within 30 minutes)

  • Devices=24,000
  • Batch size=200

During any particular iteration of the Profile Publish Batch Job as outlined above, if {X} number of commands are still in Pending Install state for a period of less than 30 minutes, then only ({batchSize} -{X}) commands will be released in the current iteration.  For example, if the previous batch released 200 commands, but at the time of the next batch only 50 commands have been processed by devices (so that 150 are still active), then only 50 commands will be released at the current batch.  At the time of this iteration, it will ensure that the “active” batch size returns to 200.

Scenario 3:  Devices periodically check in (within 12 hours)

  • Devices=24,000
  • Batch size=200

During any particular iteration of hte Profile Publish Batch Job, if {Y} number of commands are still in Pending Install state for a period of more than 30 minutes, then {batchSize} number of commands will be queued up to maximum limit of *{batchSize}10 commands in queue. This means that at a single point in time, the maximum of *{batchSize}10 Install Profile commands can be queued in Pending Install status.

Following Scenario 2 above, if a new batch iteration is occurring, and all active Pending Install commands are over 30 minutes old, then a full batch size will be released.  If there are {X} pending commands less than 30 minutes and {Y} pending commands greater than 30 minutes, then {batchSize} - {X} commands will be released, up until a total of *{batchSize}10 overall active commands are queued.

Scenario 4:  Devices do not check in for over 12 hours

  • Devices=24,000
  • Batch size=200

After a pending install command has been queued for over 12 hours, it no longer counts toward the *{batchSize}10 limit specified in Scenario 3.  The logic outlined in the first 3 Scenarios will continue, not counting any of these older commands.  These “older” commands remain in the command queue and are active, but no longer affect the batching logic.

Relevant Database Tables

  • dbo.BatchJob - Profile Publish places an entry with “profileVersionID” 
  • dbo.BatchJobDetail - Every Batch Job iteration will place an entry with the number of commands released as “Count”
  • deviceCommandQueue.DeviceQueue - Stores commands (profile install commands in this case) for every device

Large-Scale Performance

WS1 UEM Services/Applications

API Workflow
Batch Processing
Entity Change Queue Monitor
EventLog Processor Service
Integration Service
MEG Service
Messaging Service
Outbound Queue Monitor Service
Smart Group Service
Agent Builder Service
Background Processor Service
Compliance Service
Content Delivery
Device Scheduler
Directory Sync Service
GEM Inventory Service
Policy Engine
SMS Service
Google Play Service
Data Platform Service
Interrogator Queue Service
Provisioning Package Service
MSMQ

PerfMon Object Perfmon Counter
Process “% Privileged Time”, “% Processor Time”, “% User Time”, “Elapsed Time”, “Handle Count”, “IO Read Bytes/sec”, “IO Read Operations/sec”, “IO Write Bytes/sec”, “IO Write Operations/sec”, “Private Bytes”, “Thread Count”, “Virtual Bytes”, “Working Set”, “Working Set - Private”
.NET CLR Exceptions “# of Exceps Thrown”, “# of Exceps Thrown / Sec”, “# of Filters / Sec”, “# of Finallys / Sec”, “Throw to Catch Depth / Sec”
.NET CLR LocksAndThreads “# of current logical Threads”,"# of current physical Threads","# of current recognized threads", “# of total recognized threads”,“Contention Rate / Sec”,“Current Queue Length”,“Queue Length / sec”, “Queue Length Peak”,“rate of recognized threads / sec”,“Total # of Contentions”
.NET CLR Memory “% Time in GC”,"# Bytes in all Heaps","# Gen 0 Collections","# Gen 1 Collections","# Gen 2 Collections", “# Induced GC”,“Allocated Bytes/sec”,“Finalization Survivors”,“Gen 0 heap size”,“Gen 1 heap size”, “Gen 2 heap size”,“Large Object Heap size”,"# of Pinned Objects","# GC Handles","# of Sink Blocks in use", “# Total committed Bytes”,"# Total reserved Bytes",“Finalization Survivors”,“Gen 0 Promoted Bytes/Sec”, “Gen 1 Promoted Bytes/Sec”,“Large Object Heap size”,“Process ID”,“Promoted Finalization-Memory from Gen 0”, “Promoted Memory from Gen 0”,“Promoted Memory from Gen 1”
.NET Data Provider for SqlServer “NumberOfActiveConnections”, “NumberOfFreeConnections”, “NumberOfPooledConnections”, “NumberOfReclaimedConnections”, “SoftConnectsPerSecond”, “SoftDisconnectsPerSecond”
.NET Memory Cache 4.0 “Cache Entries”, “Cache Hit Ratio”, “Cache Hits”, “Cache Misses”, “Cache Trims”, “Cache Turnover Rate”
MSMQ Service “Total bytes in all queues”, “Total messages in all queues”

IIS Web Server Performance Counters

PerfMon Object Perfmon Counter
Web Service “Service Uptime”, “Current Connections”, “Bytes Sent/sec”, “Total Bytes Sent”, “Bytes Received/sec”, “Total Bytes Received”, “Bytes Total/sec”, “Total Bytes Transferred”, “Get Requests/sec”,“Total Get Requests”, “Post Requests/sec”,“Total Post Requests”, “Put Requests/sec”,“Total Put Requests”, “Delete Requests/sec”,“Total Delete Requests”, “Anonymous Users/sec”, “NonAnonymous Users/sec”, “Not Found Errors/sec”, “Locked Errors/sec”, “Total Method Requests”, “Total Method Requests/sec”
Web Service Cache “Current Files Cached”, “Active Flushed Entries”, “Total Files Cached”, “Total Flushed Files”, “File Cache Hits”, “File Cache Misses”, “File Cache Hits %”, “File Cache Flushes”, “Current File Cache Memory Usage”, “Maximum File Cache Memory Usage”, “Current URIs Cached”, “Total URIs Cached”, “Total Flushed URIs”, “URI Cache Hits”, “URI Cache Misses”, “URI Cache Hits %”, “URI Cache Flushes”, “Current Metadata Cached”, “Total Metadata Cached”, “Total Flushed Metadata”, “Metadata Cache Hits”, “Metadata Cache Misses”, “Metadata Cache Hits %”, “Metadata Cache Flushes”, “Kernel: Current URIs Cached”, “Kernel: Total URIs Cached”, “Kernel: Total Flushed URIs”, “Kernel: URI Cache Hits”, “Kernel: Uri Cache Hits/sec”, “Kernel: URI Cache Misses”, “Kernel: URI Cache Hits %”, “Kernel: URI Cache Flushes”
ASP.NET “Application Restarts”, “Requests Queued”, “Requests Rejected”
ASP.NET Applications “Requests/Sec”, “Errors Total”, “Cache Total Entries”, “Cache Total Turnover Rate”, “Cache Total Hits”, “Cache Total Misses”, “Cache Total Hit Ratio”, “Pipeline Instance Count”, “Requests/Sec”, “Requests In Application Queue”, “Request Execution Time”, “Request Wait Time”, “Requests Executing”
HTTP Service Request Queues “ArrivalRate”, “CurrentQueueSize”,“RejectedRequests”